Last days SCOM reported “SQL DB Average Wait Time is too high” monitoring tickets where the limit set to 250ms.
When I tried to check “SQL Server Locks counters” via PowerShell, I found extremely high value in “AverageWaitTimems” property.
How to find the “_PerfRawData_MSSQL_Locks” object:
Get-WmiObject -List | ?{$_.Name -like "*PerfRawData_MSSQL*Locks"} | Select Name
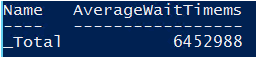
Get actual “AverageWaitTimems” property:
Get-WmiObject Win32_PerfRawData_MSSQLInstanceNameLocks | ?{$_.Name -like "_Total"} | Select Name, AverageWaitTimems | Format-Table -AutoSize
If you check the community addition below the page you’ll see a post how you should calculate the the real value from raw data. Please check “PERF_AVERAGE_BULK” section in the “Interpreting the counter values from sys.dm_os_performance_counters” to see how it works really. You can find here others as “Buffer cache hit ratio, Transactions, Total pages”.
Example to calculate the real value:
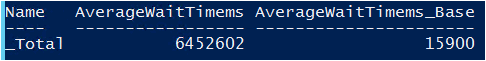
Get-WmiObject Win32_PerfRawData_MSSQLInstanceNameLocks | ?{$_.Name -like "_Total
"} | Select Name, AverageWaitTimems, AverageWaitTimems_Base | Format-Table -AutoSize
Sample 1
Sample 2
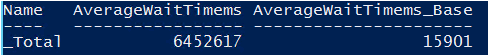
Calculated data:
(Sample2.AverageWaitTimems-Sample1.AverageWaitTimems)/(Sample2.AverageWaitTimems_Base-Sample1.AverageWaitTimems_Base)
(6452617-6452602)/(15901-15900)=15
You can check it via “CookedValue” based on the MSSQL$INSTANCE:Locks(_Total)\Average Wait Time (ms) counter.
Get-Counter -Counter '\MSSQL$INSTANCE:Locks(_Total)\Average Wait Time (ms)'
How to find counter to the “_PerfRawData_MSSQL_Loks” object:
Get-Counter -ListSet * | ?{$_.CountersetName -like "*MSSQL*Locks*"} | Select -expand Paths
Hello! This is my first visit to your blog!
We are a group of volunteers and starting a new project in a community
in the same niche. Your blog provided us valuable information to work on. You have
done a wonderful job!